
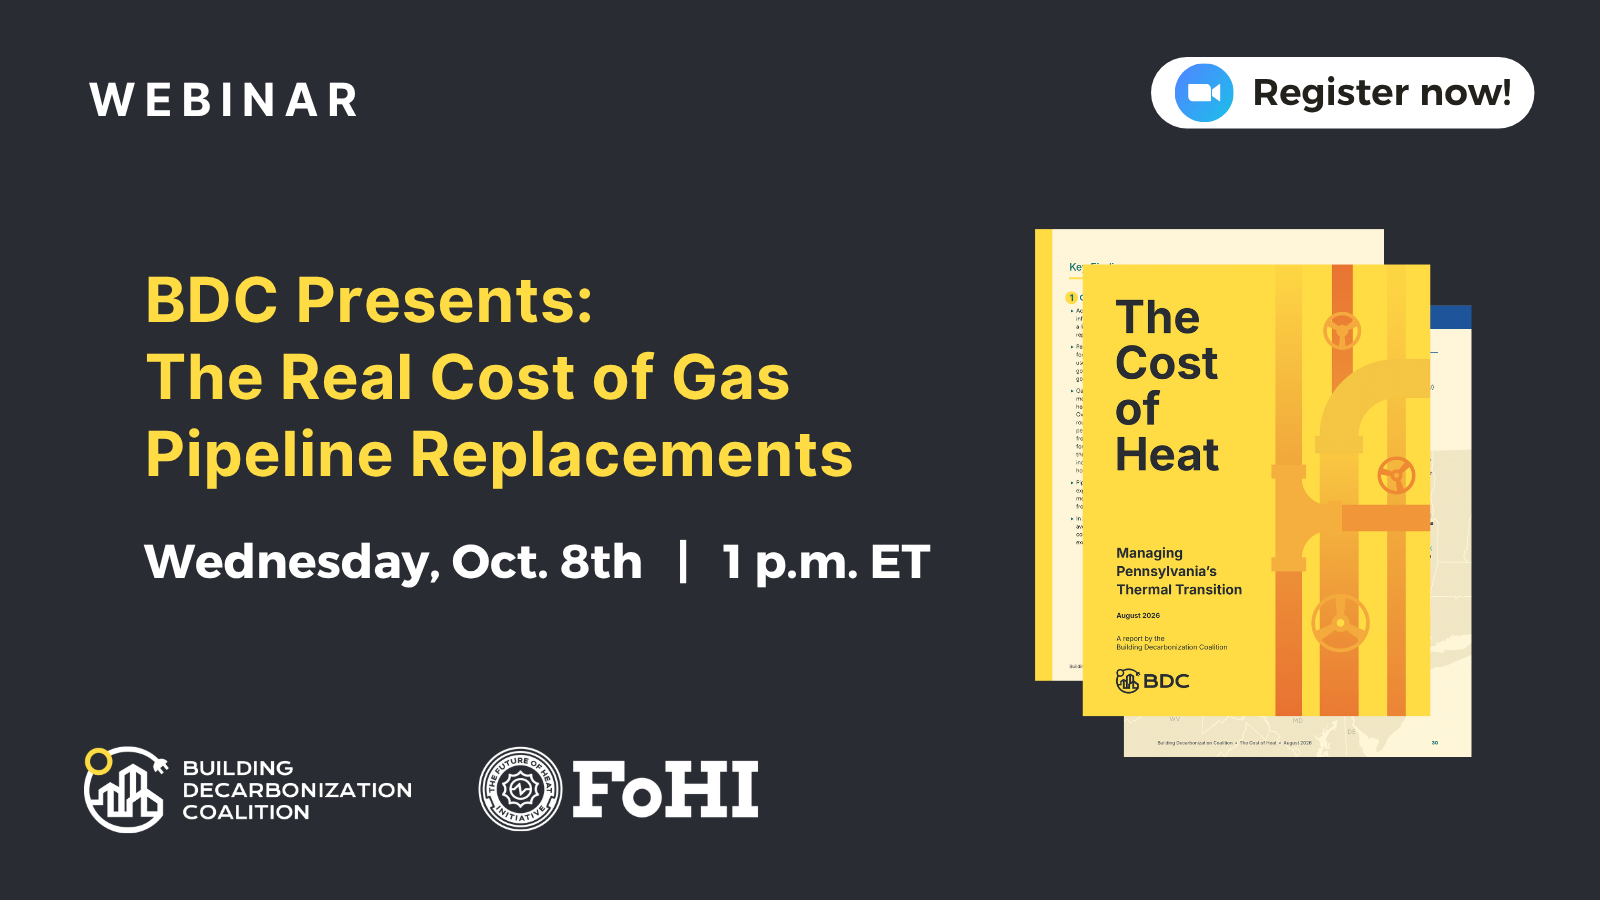
Recorded Live on Thursday, Oct. 8, 2026: The Building Decarbonization Coalition (BDC) and the Future of Heat Initiative (FOHI) discuss the mounting costs and safety outcomes of accelerated gas pipeline replacement programs.
As many as 43 states and Washington, D.C. have had some form of accelerated replacement program, many established or expanded following high-profile pipeline safety incidents and a federal “Call to Action.” By allowing gas utilities to recover capital costs from customers more quickly, often through monthly bill surcharges, these programs have helped accelerate spending on gas infrastructure. Nationwide, 71% of a typical customer’s gas bill now goes toward gas pipelines, while 29% pays for the gas itself.
More than a decade later, the costs continue to mount. BDC’s recent report, The Cost of Heat: Managing Pennsylvania’s Thermal Transition, finds that Pennsylvania’s six largest gas utilities have spent $11 billion through Act 11-enabled accelerated replacement programs since 2013. New research from the Future of Heat Initiative also finds that accelerated replacement programs have not produced meaningful improvements in pipeline safety.
Using Pennsylvania and Massachusetts as case studies, we examine how states can reform these programs to better target safety investments, strengthen regulatory oversight, protect customers from unnecessary costs, and require consideration of non-pipeline alternatives.
Speakers
- Kristin George Bagdanov, Associate Director of Research, Building Decarbonization Coalition
- Justin Gundlach, General Counsel & Director of Research, Future of Heat Initiative
- Tiffany Vu, Associate Manager of Research, Building Decarbonization Coalition
Additional Resources
Webinar Notes
Kristin George Bagdanov, BDC
Pipeline replacement has driven up costs without necessarily making systems safer. Customers pay for each new gas pipe for 60 to 70 years. This webinar will highlight how the costs have increased and what we can do.
Advanced Pipeline Replacement Program Overview: Tiffany Vu, BDC
Accelerated pipeline replacement programs let utilities recover replacement costs through bill surcharges between rate cases. They usually target pipes made of leak-prone materials such as cast iron.
“Accelerated” refers to how fast costs are recovered, not how fast pipe is replaced. Utilities can still recover costs the regular way, through a general rate case.
Future of Heat Initiative estimates utilities have spent $250 billion on distribution over the past 15 years. American Gas Association (AGA) reports $33 billion a year in pipeline safety spending.
According to the American Gas Association , 43 states and D.C. have had accelerated pipeline replacement programs. Where state-level data exists, spending on pipelines ranges from a few hundred million dollars to nearly $1 billion a year.
With affordability now a central concern, states are reviewing these programs. Reform options include capping spending or surcharges, ending accelerated recovery, and requiring utilities to evaluate non-pipeline alternatives.
Spending and Safety Outcomes: Justin Gundlach, Future of Heat Initiative
Discussions of safety and discussions of cost are rarely brought together. There’s been little study of whether specific kinds of safety spending are over- or undervalued.
There’s no national lab for gas, and regulators have limited research resources. Future of Heat Initiative (FOHI) puts about two-thirds of its work into research for regulators and one-third into direct technical assistance. FOHI does not take part in proceedings.
Distribution capital spending grew about 200% from 2011 to 2023, after roughly flat growth from 1990 to 2010. System expansion doesn’t explain the increase. An estimated 50% to 70%, about $14 to $22 billion a year, now goes to pipeline replacement.
Two things changed in 2011. Utilities’ first Distribution Integrity Management Program (DIMP) filings came due (the rule was finalized in 2009), and the Pipeline and Hazardous Materials Safety Administration (PHMSA) issued its Call to Action after a series of major pipeline failures.
The national trend in significant incidents didn’t measurably change after 2011. In high-replacement states, incident rates rose, linked to excavation and outside-force damage. That points to a hypothesis that replacement work itself may add risk.
PHMSA counts an incident as “significant” partly based on whether someone was hospitalized as an inpatient. U.S. hospitalization rates have fallen for decades for reasons unrelated to gas systems. Injury-only events make up about 70% of the reported decline in incidents, so that decline may come partly from how the data is collected.
Utilities’ own risk rankings put aging-pipe risks like corrosion below others, such as excavation damage. Spending follows the opposite pattern: pipe replacement is funded far more heavily than measures against excavation damage.
Utility commissions can require spending to be tied to safety benefits, but it’s hard to say no to a safety claim.
Version 1.1 of the report is coming soon. Recommendations will be developed together with safety officials and experts.
Case Study: Pennsylvania’s Act 11: Kristin George Bagdanov, BDC
Act 11 (2012) lets Pennsylvania utilities recover distribution investments through a bill surcharge. It has received little public scrutiny.
Since 2013, the six major gas utilities have spent $11 billion through the program, which is now their main investment channel. With financing costs and shareholder returns, customers will pay roughly $30 billion over the lifetime of these assets.
Pennsylvania has fewer guardrails than Massachusetts, Maryland, and D.C. Those states have lowered surcharges, set sunset dates, or required analysis of non-pipeline alternatives.
Since Act 11, utility assets have grown 8% to 10% a year. Customer counts have grown 0% to 1% a year, and residential gas use is down 28% since 2000. Each customer’s share of system costs has doubled, and monthly residential bills are up about two-thirds over the past decade.
Replacing a mile of pipe now costs almost $3 million, which works out to about $40,000 per customer. That’s enough to electrify those homes or help fund a thermal energy network.
Recommendations
- End accelerated cost recovery.
- Require utilities to compare pipe replacement against non-pipeline alternatives.
- Scrutinize the risk models utilities use to decide which pipe to replace.
- Make utility spending data more transparent.
Q&A
-
Hilary: Replacement is a risk factor--does that mean that plastic pipe is more vulnerable to excavation damage, or that replacement involves excavation or other activity that creates risk?
-
Justin: Based on our initial examination of what accounts for the relatively high risk of young plastic pipe, my understanding is that it has to do with factors that don’t necessarily include plastic being more vulnerable to excavation damage. That added vulnerability does seem to be an issue, but it shows up in the data in subtle ways. Often it comes from excavators in the area being used to work around metal pipe, where they can ping it without puncturing it. With plastic, the same contact punctures the pipe. So the simple fact that an excavator can puncture plastic more easily isn’t what explains why young plastic tends to cause trouble. That said, the relative vulnerability of plastic is sometimes a safety issue.
-
-
Scott: Could you say more about how reporting may not be accurately reporting injury incidents?
-
Justin: This is something we’re still looking at here at FOHI to figure out exactly what’s going on. The basic insight is this: starting in the ’80s and continuing through the 2000s, there have been four different kinds of pressure on inpatient hospitalization, and none of them have to do with the pipeline system. We weren’t the first to identify this. Using inpatient hospitalization as a proxy for severe injury has come up in other areas, where other federal agencies relied on it to distinguish severe injuries from less severe ones. They also found that hospitalization rates were sliding even though the injuries hospitals saw weren’t changing in any material way. Our observation applies that finding to PHMSA, which has relied on this metric for decades even as the ground shifted under it. I hope that’s something of an answer, if not a complete one.
-
-
Alice: What influences the cost per mile of new gas main replacement? Looking at the per mile cost of pipeline by utility, why is UGI’s so high? Does it have fewer customers? Does ROI also influence that per mile cost?
-
Kristin: I don’t have UGI’s customer data on hand, but a number of things affect pipeline costs. For the slide you’re referring to, we calculated that even after inflation, costs rose 70%, so it’s not just inflation and materials. Costs can vary a lot by utility. PGW, for example, works in a dense urban environment, where replacing a pipe can require more street closures and other infrastructure work, and that can raise costs. So density is a factor, but we don’t entirely know why costs vary so much across utilities. You’d expect that for work utilities do all the time, knowledge, economies of scale, and efficiency would keep costs stable or bring them down. It’s still somewhat of a mystery, and we can’t pin down all the factors because of the lack of transparency and access to data. Utilities typically don’t report cost per mile unless they’re required to, so in Pennsylvania we had to piece it together from what they did report. Justin, feel free to add anything.
-
-
-
Justin: Replacing a pipe in a dense environment, where closing the street is harder and you’re navigating six different kinds of utility lines, is going to cost more than replacing a radial line on a street so few people use that it doesn’t really need closing. So density matters quite a lot, both traffic near the pipe and other utilities underground. But as Kristin said, some of the factors that matter aren’t available in public data. They come down to the timing of decisions made by various people, including paving schedules and the availability of crews to do the work. There are all kinds of mysteries wrapped into the final number.
-
-
Sean: In Pennsylvania, were there any differences to note between PGW and the IOUs considering their different ownership and financial incentive structures?
-
-
Kristin: As we said, there’s a big cost difference. PGW was already running a very regimented pipeline replacement program because of its old stock of cast iron pipe. According to its reporting, it now also does accelerated replacement, so together those programs roughly double its pace of cast iron replacement. From what I’ve seen, there have been studies at PGW about thermal energy networks and the workforce. Because of its different governance structure, I think there’s more openness, and more room for public pressure, to have the utility explore what it means to be a thermal utility and possibly begin transitioning some segments to thermal energy networks. So we’ve seen more positivity, and more space for collaboration, with PGW as a municipal utility.
-